Primary sources used in this edition
- Global social connection: WHO Commission on Social Connection, “From loneliness to social connection: charting a path to healthier societies”, 30 June 2025 ↗. Approximately 1 in 6 people worldwide reported loneliness; WHO’s report body states 16% and its Q&A 15.8%. By age band WHO reports 20.9% (13–17), 17.4% (18–29), 15.1% (30–59) and 11.8% (60+). All figures are pooled survey data covering 2014–2023, not a 2025 snapshot. WHO measures loneliness, which is distinct from social isolation.
- Drivers of disconnection: WHO, Social connection Q&A, 30 June 2025 ↗. WHO names major life changes such as moving, job loss, relationship breakups, retirement and bereavement. WHO also states that loneliness rates generally decrease with age; this deck does not claim that people become lonelier as they get older.
- Australian loneliness: Australian Institute of Health and Welfare, “Social isolation and loneliness”, updated 12 May 2026 ↗. In 2024 people aged 35–44 showed the highest rate of loneliness at 17%, from HILDA Survey data. AIHW separately reports 15% social isolation among Australians aged 15 and over in 2024; that is a different measure and is not used here.
- Auckland population: Stats NZ, “Our region: Auckland”, 2023 Census ↗. 770,949 usual residents aged 30–64 in the Auckland Region, census reference date 7 March 2023. Auckland Region and Auckland territorial authority share the same boundary. 2023 Census counts are randomly rounded to base three, so the six-significant-figure number carries less precision than it appears to.
- Australian population: Australian Bureau of Statistics, Regional population by age and sex, 2025 ↗. 12,425,465 people aged 30–64 in the estimated resident population at 30 June 2025. The September 2026 edition of this deck carried 11,597,665 from the 2021 Census; that is a census count four years older, not an error.
- Transaction precedents: Match Group / Hyperconnect, US$1.725bn, announced 9 Feb 2021, closed 17 Jun 2021, 50% cash and 50% stock ↗; Bumble / Geneva, US$17.5m total cash consideration, completed 1 Jul 2024, Bumble Q3 2024 Form 10-Q ↗; Bending Spoons / Meetup, completion announced 24 Jan 2024, price not disclosed in any primary source ↗; Bending Spoons / Eventbrite, US$4.50 per share in cash, approximately US$500m, announced 2 Dec 2025, closed 10 Mar 2026 ↗.
- Financing-market context: Carta, State of Pre-Seed: 2025 in Review, published 19 Feb 2026 ↗. Median valuation caps on post-money SAFEs hovered around US$10 million for 2025 rounds in the US$250,000 to US$1 million range. This is US-only, Carta-platform data. It is context, not a determinant of SPARK’s value.
How to read the market illustration
- Age 30–64 is a modelling lens, not a membership eligibility rule. The census base precedes serviceability, interest, affordability, suitability and willingness-to-pay filters.
- The 1,000-member Auckland figure is an operating proof target set by management, not a forecast, a commitment or observed demand. 1,000 ÷ 770,949 = approximately 0.13%. 1,000 × NZ$240 = NZ$240,000 annualised.
- 1% paid penetration is an illustrative assumption, not observed conversion. Exact arithmetic: 770,949 × 1% × NZ$240 = NZ$1,850,277.60.
- NZ$240 is NZ$20 per month annualised, SPARK’s published New Zealand price. It is not demonstrated realised revenue per member. Thailand membership is priced in US dollars at US$20 per month.
- Gross membership billings assume a full year at full price. They exclude event and venue revenue and do not deduct churn, discounts, refunds, taxes, payment fees, acquisition costs or operating costs.
- The full Auckland cohort multiplied by NZ$240 is NZ$185,027,760: a mathematical demographic ceiling, not a measured market, a commercial TAM or a revenue forecast.
- Auckland and Australia are separate geographic reference points on different bases and years. They are not a combined ANZ market total, and the Australian cohort is never multiplied by price in this deck.
- City population in the expansion roadmap is density context only. India’s most recent census is 2011, so any current Indian city figure is a projection rather than a count.
Internal evidence and its limits
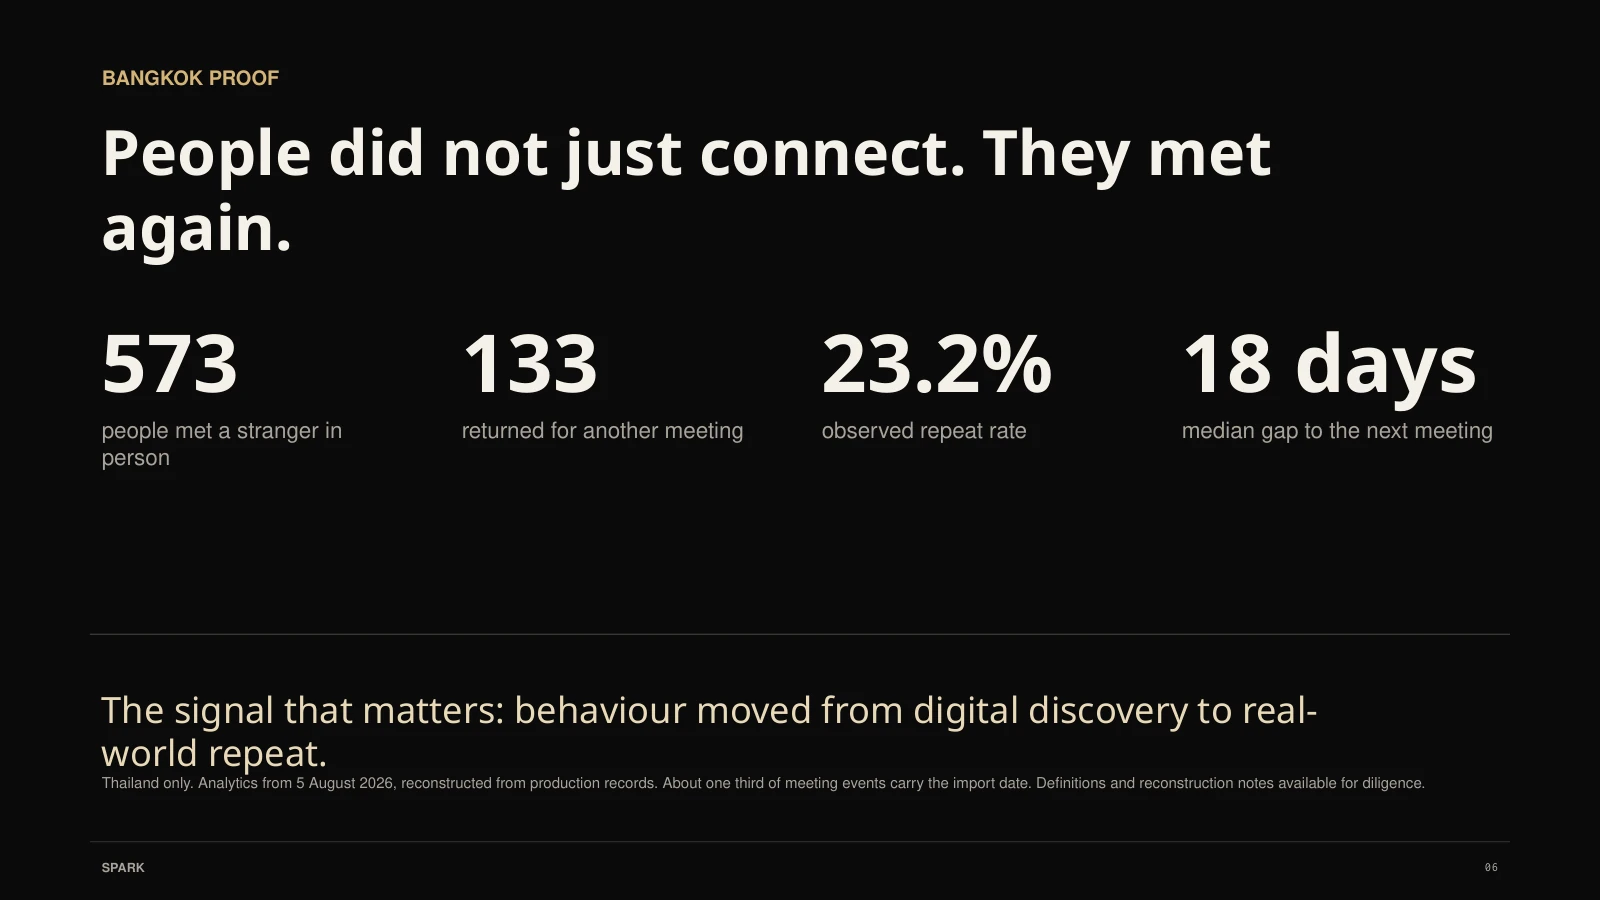
Bangkok behavioural proof: 573 people met a stranger in person, 133 returned, a 23.2% observed repeat rate and an 18-day median gap to the next meeting. Thailand only. Analytics run from 5 August 2026 and earlier events were reconstructed from production records; about one third of meeting events carry the import date rather than the real one. Definitions and reconstruction notes are available for diligence.
App traction: 12,825 installs and US$0 paid marketing from the Bangkok launch, as reported by the founder on 3 September 2026. Installs are not members, and US$0 paid marketing is not zero acquisition cost.
Physical events: venue names, dates and free-or-ticketed status are taken from SPARK’s own event records. Past registrations are not attendance.
SPARK Tables remain in development. Nothing in this deck offers a guaranteed introduction, a guaranteed match, a guaranteed Table place, a Table every month, an included meal or unlimited event seats.
Financing: SPARK has raised US$400K to date and is now raising a further US$600K pre-seed extension via SAFE at a US$8 million valuation cap, with no discount. The valuation cap is a SAFE conversion term, not a company valuation or a priced equity round. Prior financing documents are available in diligence.
Source notes retained from the prior edition. Historical dates and measurement limitations remain explicit.

 01
01